CALIFORNIA STATE UNIVERSITY, SACRAMENTO
Department of Economics
Economics 100A
Prof. Yang
Solutions to Homework Problems
Chapter 1
Numerical

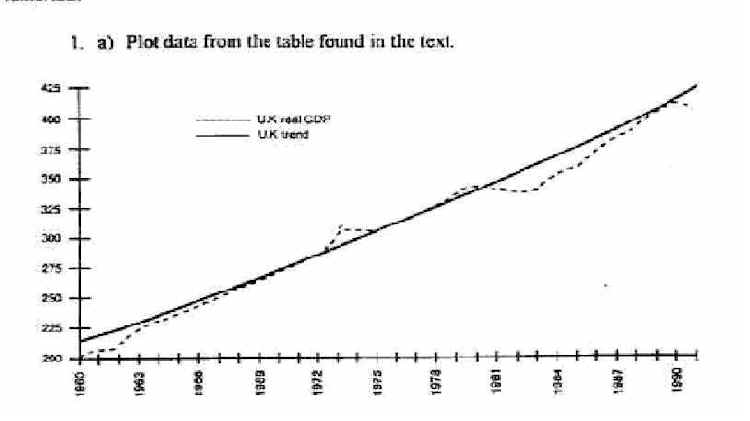
b) Real GDP grew by 2.2% on average between 1960 and 1991.
c) There were only three periods in which
GDP declined: the 1973-75 recession, the 1980-81 recession,
and the 1991 recession.
Those were recessions in the U.S. as well. The U.K. did not experience
the smaller 1969-70
recession.
3. a, b, and c)
Year Inflation p e = .5 (p -1 + p -2) R = i - p e p e = p R = i - p e
1978
7.6%
7.6%
0.0%
1979
11.3
11.3
-1.3
1980
13.5
9.4%
2.0%
13.5
-2.1
1981
10.3
12.4
1.4
10.3
3.5
1982
6.2
11.9
-.8
6.2
4.9
1983
3.2
8.2
.6
3.2
5.6
1984
4.3
4.7
5.2
4.3
5.5
1985
3.6
3.7
3.9
3.6
4.0
1986
1.9
3.9
2.1
1.9
4.1
1987
3.6
2.7
3.4
3.6
2.5
1988
4.1
2.7
4.2
4.1
2.8
1989
4.8
3.8
4.2
4.8
3.2
1990
5.4
4.5
3.0
5.4
2.1
1991
4.2
5.1
.4
4.2
1.3
1992
3.0
4.8
-1.2
3.0
.6
1993
3.0
3.6
- .5
3.0
.2
1994
2.6
3.0
1.7
2.6
2.1
1995
2.8
2.8
2.8
2.8
2.8
d) The real interest rate is defined as the nominal interest rate
minus expected inflation. But economists
have no way of drectly observing agents'
expectations of inflation. Therefore, economists' estimates
of the real rate can vary widely depending on
how they model expectations.
e) People try to forecast inflation rates using all the
information that is available to them at the time of forecast.
They use all kinds of information: economic,
political, environmental, etc. Naturally, they do not
systematically understimate changes in the
level of prices. Sometimes they underestimate and sometimes
they overestimate.
Analytical
1. In the flexible price model, output is determined by
aggregate sypply. Only fluctuations in aggregate
supply can produce fluctuations in output.
In the sticky price model, by contrast, output is completely
demand determined.
2. a) While such a view could explain a fall in output, it
cannot explain the increase in unemployment rates
that occurred in the
early 1980s. This is the new classical or flexible price view of macroeconomic
fluctuations.
b) Interest rates, particularly real rates,
were very high, a result of restrictive monetary policy. This depressed
aggregate
demand, and hence both output and the demand for labor. This accounts for the high
levels of
unemployment. This is a sticky price or Keynesian view of output
fluctuations. The challenfe for this view
is to explain why wages
do not adjust quickly.