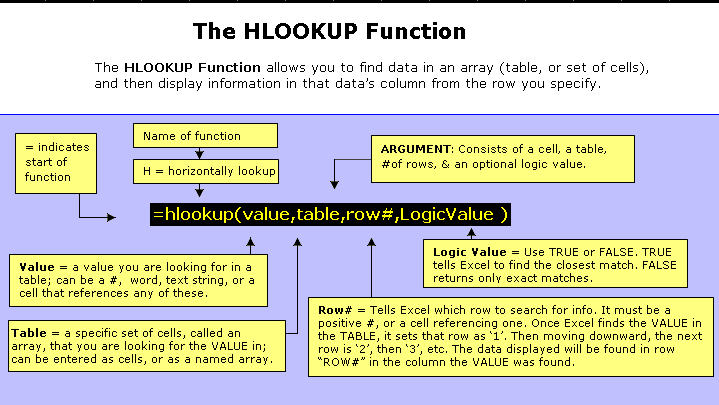
|


Q-
Fx Guide


 |
|
With This
Function:
|
| |
1. |
Excel Horizontally Looks
up the VALUE of Cell
Q2
In this case "INTC" (see Figure 2 below), |
| |
2. |
Excel Searches
in the TABLE
Named Raw in the example (see
Figure 3), |
| |
3. |
Because the argument says False,
Excel stops when it EXACTLY finds the VALUE ("INTC"), |
| |
4. |
Excel Then,
identifies the Cell that VALUE is found
("INTC") and labels it Row "1"
(NOTE: that the row might be actually #2, #15,
or any
other row but, the function disregards
all rows above of the cell containing the VALUE
looked for), |
| |
5. |
Starting with the Row containing the VALUE ("INTC")
AKA Row #1, and
moving downward,
Excel displays the
data that is found in the 7th row.
|
| |
6. |
Excel displays the results in Cell
Q8.
Final answer displayed: "-4%" |
|

NOTE:
• If you change Q2,
to "F" (w/o quotes), then the data displayed changes to -18%
(cell B8 in Raw)
• If you change the formula VALUE from Q2 to
P2, Excel looks for JNJ
in Table Raw & displays 1%
|
|