Question: Do we have any knowledge not obtained by our senses?
Question: Can we detect everything there is to detect in the environment?
 normal visual
spectrum of light
 ultra violet
light
Other examples?
Sensation & Perception
Introduction:
"There is no conception in man's mind which hath not at first, totally or by parts, been begotten upon the organs of sense." (T. Hobbes, 1651).
Question: Do we have any knowledge not obtained by our senses?
Question: Can we detect everything there is to detect in the environment?
normal visual spectrum of light
ultra violet light
Other examples?
Sensation & Perception:
Sensation:
e.g.
Transduction:
e.g.
Perception:
e.g.
Cognition:
e.g.
Action:
The Perception/Action Cycle:
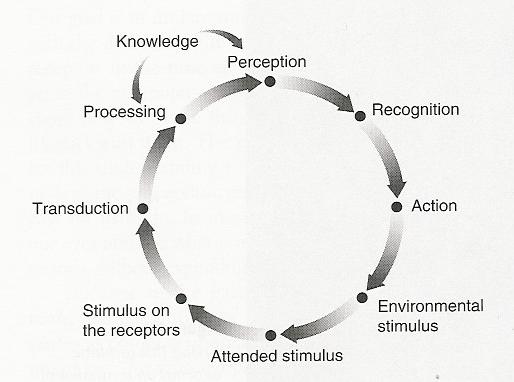
"We must perceive in order to move, but we must also move in order to perceive". (Gibson, 1979)
e.g.
Perception's Main Themes:
1. Sensory Transduction & Neural Coding:
2. Differences Among Species and Among Individuals:
e.g. Where eyes are located.
3. Clinical Insights and Disordered Perception:
e.g.
4. Top-down influences:
a) top-down:
e.g.
e.g.
b) bottom-up:
Methods for Studying Sensation & Perception
Question in S&P: Do our perceptions match the physical stimulus from the environment?
How is perception measured?
1. Phenomenological Method:
e.g.
Problems:
a)
e.g.
e.g. Anton's Syndrome:
two different areas of brain damaged:
1)
2)
b)
2. Biological Approaches:
a) Lesion Techniques:
b) Brain Imaging Techniques:
e.g. positron emission tomography (PET)
e.g. fMRI (functional magnetic resonance imaging)
c) Single-cell Techniques:
3. Experimental Approaches:
a) Psychophysical Methods: original methods showing that mental activity could be quantified. 1st Focused on Detection Thresholds (Gustav Fechner, 1801-1887)
i)Absolute Threshold -
e.g.
- Fechner's 3 Types of Methods for measuring Absolute Thresholds
1. Method of Limits -
- Descending series:
- Ascending Series:

- Advantage:
- Disadvantage:
1.
2.
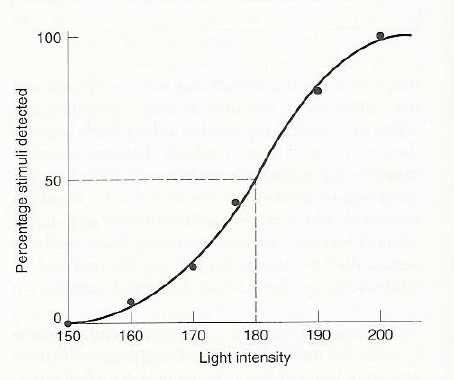
2. Method of Constant Stimuli-
e.g.
- Advantage:
- Disadvantage:
- Disadvantage:
3. Method of Adjustment -
e.g.
- Advantage:
- Advantage:
- Disadvantage:
Some approximate absolute threshold values. (Table 2.1 in text)
Light: A candle flame seen at 30 miles on a dark clear night
Sound: The tick of a watch under quiet conditions at 20 feet.
Taste: One Tsp of sugar in 2 gallons of water.
Smell: One drop of perfume diffused into the entire volume of a 3-room apartment
Touch: The wing of a bee falling on your cheek from a distance of 1 cm.
ii) Difference Threshold - (via Ernst Weber)
e.g.
method:
jnd (just noticeable difference):
DL=
jnd=
e.g.
Ernst Weber's findings -
e.g. a hypothetical example of a difference that can be detected:
standard stimulus = 10
comparison = 121 jnd = 2 units at intensity 10
but
standard stimulus = 100
comparison = 1201 jnd= 20 units at intensity 100
A. Weber Fraction:
k= DI / I
k=
DI =
I =
example:
Some Real Weber Fractions:
Taste:
Pitch of pure tones:
Research on Weber's Law:
- useful for a number of discrimination situations
- but this fraction only holds true for values in the middle range of detection.
iii) Magnitude Estimations-(S. S. Stevens) -- different approach to relation between stimulus intensity and perceptual magnitude.
Method:
Results:
Stevens's Power Law:
S = kI n
S=magnitude estimation
k=constant
I=physical intensity
n= exponent/power
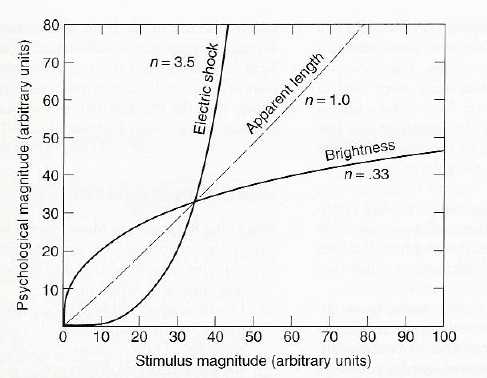
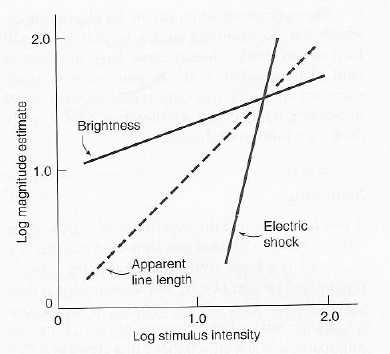
Some known Exponents for Stevens's Power Law:
Brightness = .33
Apparent Length =1.0
Electric Shock = 3.5
Heaviness =
Smell (coffee odor) =
Temperature (warmth) =
Temperature (cold) =
- some powers appear to be unstable, however.
Final note about Weber and Stevens Laws:
c) Signal Detection Theory (SDT):
Process 1:
a) person
b) stimulus intensity
Process 2:
General Method used to examine these 2 processes.
Task:
Example: say if a different sized dot (signal) is present or not
(display only shown for a second)
| NOISE ALONE: | NOISE + SIGNAL: | ||||
Four possible outcomes can occur for any given trial.
Observer's Response "Yes, I do hear it"
"No, I don't hear it"
Presence or Absence of Signal
Present
Absent
Can use this experimental method to separate out the two processes:
Dot Example:
Process #1
a) person: some people have better vision and discrimination abilitities
b) stimulus intesity:
| NOISE + SIGNAL: (easy) | versus | NOISE + SIGNAL: (hard) | ||||
Process #2: criterion
I'll give you $1 for every "Hit" you get.
versus
I'll take away $1 for every "False Alarm" you get.
Example 2: detecting the phone ringing when in living room vs. shower.
process #1:
process #2:
Hyothetical Results from SDT experiment:
Observer's Response "Yes, I do hear it"
"No, I don't hear it"
Presence or Absence of Signal
Present
0.75
0.25
Absent
0.30
0.70
There are 2 ways to change the results:
1)
2)
e.g. Could present the signal on 90% of the trials (or give high payoff for hits relative to low deduction for mistakes)
Observer's Response "Yes, I do hear it"
"No, I don't hear it"
Presence or Absence of Signal
Present
Absent
Could present the signal on only 10% of the trials (or give high payoff for correct rejections & low reduction for mistakes)
Observer's Response "Yes, I do hear it"
"No, I don't hear it"
Presence or Absence of Signal
Present
Absent
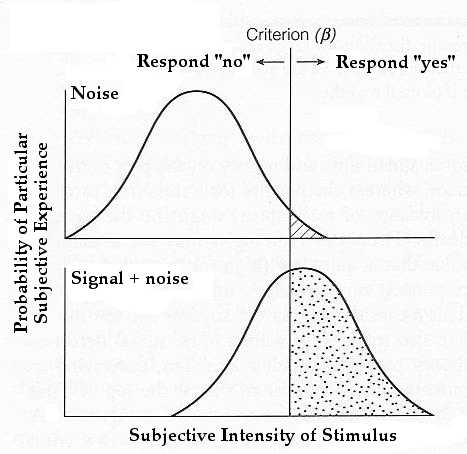
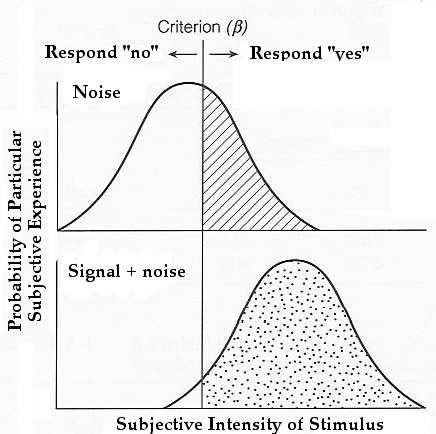
How to Determine Sensitivity and Criterion:
use Probability Distributions:
Noise Distribution: shows probability of achieving a given perceptual effect on noise trials.
Signal + noise Distribution: shows the probability of achieving a given perceptual effect on signal + noise trials
Measuring Sensitivity and Criterion with SDT using Probability Distributions:
1. Sensitivity = d' (d-prime)
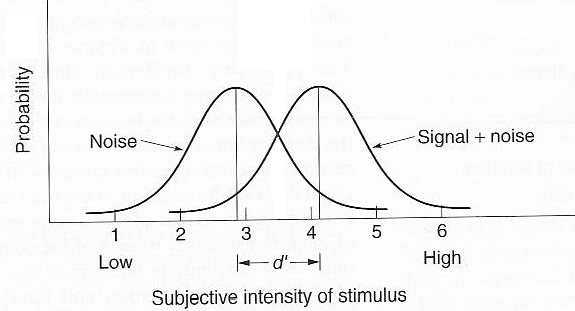
e.g. high sensitivity
e.g. low sensitivity
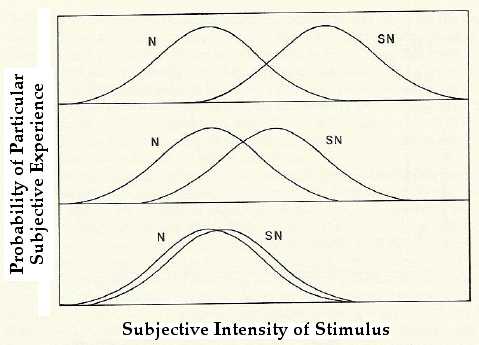
2. Criterion = b (beta)
e.g. Conservative criterion
e.g. Liberal criterion
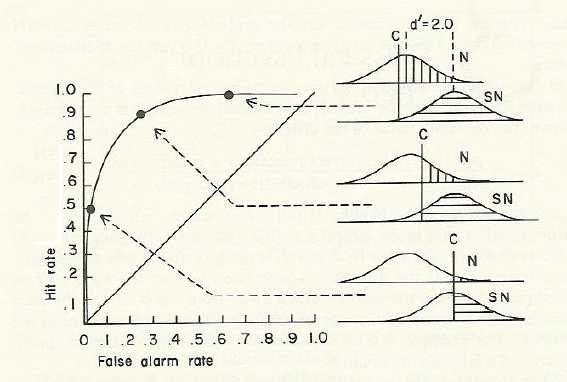
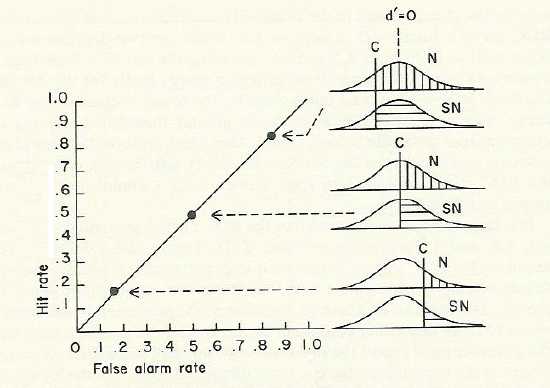
Receiver Operating Characteristic Curves (ROC Curves)
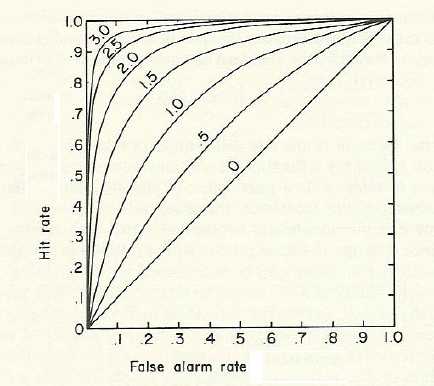
e.g.
