Section IV:
I. Correlation & Regression (looking for relationships between variables)
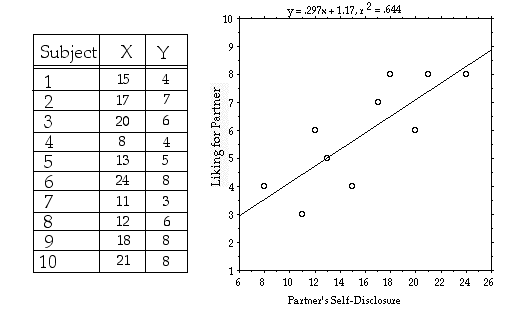
Sample Data:
| Subject | X | Y |
| 1 | 15 | 4 |
| 2 | 17 | 7 |
| 3 | 20 | 6 |
| 4 | 8 | 4 |
| 5 | 13 | 5 |
| 6 | 24 | 8 |
| 7 | 11 | 3 |
| 8 | 12 | 6 |
| 9 | 18 | 8 |
| 10 | 21 | 8 |
Scatterplot
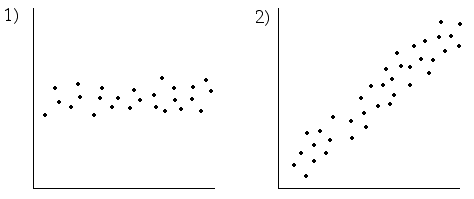
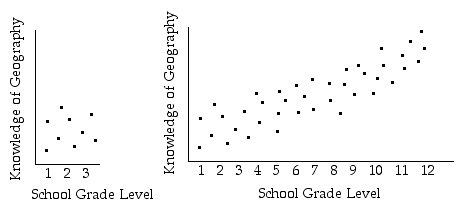
II. Overview of Correlation (r)
e.g.
e.g.
e.g.
|
|
|||
|
||||
|
|
|||
|
||||
|
III. Inferences about Correlation
Hypothesis Testing Steps:
1. State Hypotheses
- HA:
- H0:
- ex: (partners)
2. Make Graph
3. Find Critical Value (a = .05) New Table
- need a, df (n-2), and directionality
- ex: (partners)
- rcrit =
4. State Decision Rules
- ex:
5. Calculate Test Statistic
- Calculating r
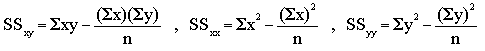
- SSxy =
- SSxx =
- SSyy =
- Sxy =
- Sx =
- Sy =
- Sx2 =
- Sy2 =
- SSxy =
- SSxx =
- SSyy =
- rcalc =
6. State Assumptions
- subjects are randomly and independently sampled
- population distributions of X & Y are normal
7. Draw Conclusion (include both magnitude and direction in conclusion)
- ex:
Coefficient of Determination (r2)
- r2 =
- interpretation:
Subject # cigarettes days absent 1 0 1 2 0 3 3 0 8 4 10 10 5 13 4 6 20 14 7 27 5 8 35 6 9 35 12 10 44 16 11 53 10 12 60 16
- Hypotheses
- Graph
- Critical Value, rcrit (a = .01)
- Decision Rule
- Test Statistic
- SSxy = 792.25
- SSxx = 4842.25
- SSyy = 284.25
- Conclusion
- p-value, Type I & Type II errors
- r2 value & interpretation
IV. Caveats to Correlation Analysis