Back to
Experimental Designs: 2-group designs (review)
one independent variable with 2 levels
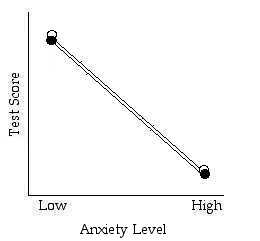
e.g. effect of anxiety on a test score
I.V. =
level 1 =
level 2 =
but what about moderate anxiety???
Test using a single factor - multiple level design
one independent variable - more than 2 levels
e.g. effect of anxiety on a test score
I.V =
level 1 =
level 2 =
level 3 =
Advantage:
Factorial
Designs
e.g.
e.g. Factor 1 =
2 levels
1)
2)
Factor 2 =
2 levels
1)
2)
| Anxiety Level | |||
| Low | High | ||
| Test Type | Multiple Choice | ||
| Short Answer | |||
Groups vs Levels:
# groups in the experiment?
# levels in the experiment?
A 2 x 3 design -
| Anxiety Level | ||||
| Low | Moderate | High | ||
| Test Type | Multiple Choice | |||
| Short Answer | ||||
Groups vs Levels:
# groups in the experiment?
# levels in the experment?
A 3 x 3 design -
| Anxiety Level | ||||
| Low | Moderate | High | ||
| Test Type | Multiple Choice | |||
| Short Answer | ||||
| Fill in the Blank | ||||
Groups vs Levels:
# groups in the experiment?
# levels in the experiment?
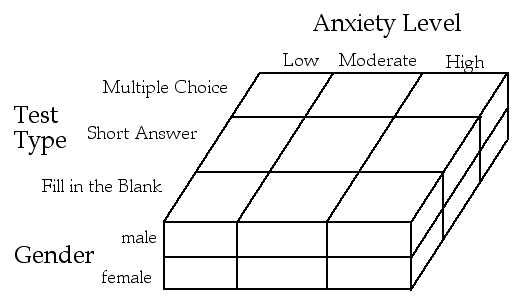
What if we added a 3rd Factor????? (I.V.)
e.g. gender
1st I.V. =
2nd I.V. =
3rd I.V. =
Design notation???
Hypotheses of Factorial Designs:
Main Effect Hypothesis:
e.g.
Interaction Hypothesis:
e.g.
Estimating Main
Effects:
Anxiety level
| Low | High | Total | ||
| Test Type | Multiple Choice | 10 | 20 | 30 |
| Short Answer | 40 | 10 | 50 | |
| Total | 50 | 30 | 80 |
Estimating the interaction(s):
Anxiety Level
| Low | High | Total | ||
| Test Type | Multiple Choice | 10 | 20 | 30 |
| Short Answer | 40 | 10 | 50 | |
| Total | 50 | 30 | 80 |
Be CLEAR - We are only estimating the effects here. A
statistical test must be done before we can conclude real
main effects and interactions are present.
There are MANY different types of interactions - hard to see in a table
Interactions and main effects are easier to estimate if you look at a graph of the data.
Practice Making and Estimating Main Effects and Interaction Hypothesis using TABLES:
Scenario #1: A researcher wonders whether parental level of education and children's age effects children's self-esteem. Children of parents with varying education levels (HS degree or Ph.D.), were tested at ages 10 and 14 and were asked to rate how happy they were "to be me" on a scale of 1 to 10.
Example Data:
| Age of Children | ||||
| Ten | Fourteen | Average | ||
| Parent's Education | High School Diploma | 10 | 5 | 7.5 |
| Level | Ph.D. | 10 | 5 | 7.5 |
| Average | 10 | 5 | 15 | |
Estimate if there is a main effect for Parent's Education Level.
Estimate if there is a main effect for Age of Children.
Estimate if there is an interaction present.
Scenario #2: Researchers were interested in how self-esteem (low and high) and intimacy (low and high) effect the amount of depression in a woman who has recently given birth.
Example Data:
| Intimacy | ||||
| Low | High | Average | ||
| Self Esteem | Low | 20 | 20 | 20 |
| High | 20 | 60 | 40 | |
| Average | 20 | 40 | 60 | |
Estimate if there is a main effect for Parent's Education Level.
Estimate if there is a main effect for Age of Children.
Estimate if there is an interaction present.
Scenario #3: A researcher decides to test if the number of hours a mother works a week (0, 20, or 40) has an effect on the amount of attachment her child has to her. The researcher also thinks that the sex of the child (male or female) may also be important for the amount of attachment shown by the child to the mother.
Estimating
Main Effects and Interactions using GRAPHS
1) Making a Graph:
- The dependent variable is always the Y Axis
- Choose one factor to go on the X Axis (it doesn't matter which factor)
- The levels of the other factor are plotted as separate lines within the graph.
Example:
The effect of anxiety and test type on a test score.
| Anxiety Level | |||
| Low | High | ||
| Test Type | Multiple Choice | 10 | 20 |
| Short Answer | 40 | 10 | |
OR
Practice:
| Anxiety Level | ||||
| Low | Moderate | High | ||
| Test Type | Multiple Choice | 30 | 30 | 30 |
| Short Answer | 10 | 20 | 40 | |
OR
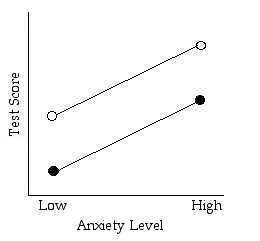
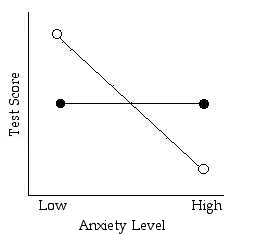
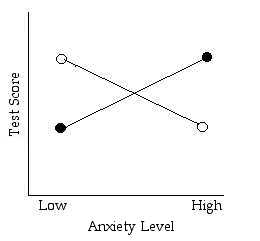
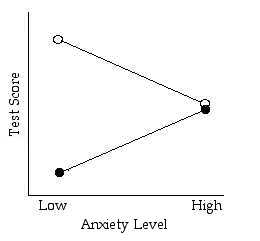
2) Practice Estimating Main Effects and Interactions by looking at the graph.
- General Rule: If the lines are not parallel there is an interaction. (should be able to describe the interaction in words)
Examples:
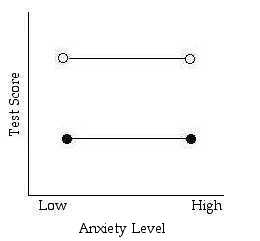
Is there a main effect for anxiety level?
Is there a main effect for test type?
Is there an interaction?
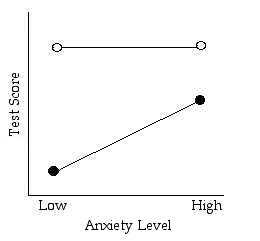
Is there a main effect for anxiety level?
Is there a main effect for test type?
Is there an interaction?
Is there a main effect for anxiety level?
Is there a main effect for test type?
Is there an interaction?
Is there a main effect for anxiety level?
Is there a main effect for test type?
Is there an interaction?
Is there a main effect for anxiety level?
Is there a main effect for test type?
Is there an interaction?
Is there a main effect for anxiety level?
Is there a main effect for test type?
Is there an interaction?
Is there a main effect for anxiety level?
Is there a main effect for test type?
Is there an interaction?