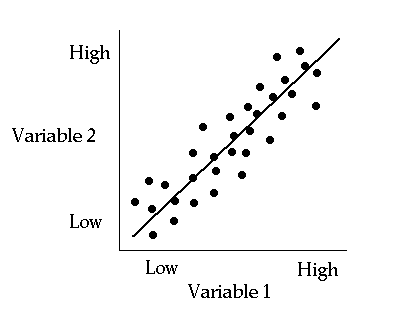
A. Direction:
Positive Correlation -

Correlational
Research
Question Asked with Experimental Designs:
Question Asked with Correlational Designs:
I. Characteristics of Correlational Research
A.
B.
II. If a correlation exists between 2 variables,
example:
A. Predictor variable -
B. Criterion variable -
III. Types of correlational relationships -
2 characteristics of correlations:
A. Direction:
Positive Correlation -
example 1: positive correlation between studying and amount learned.
example 2: between price
and quality in shopping
example 3: in children, between age and coordination skills
Negative Correlation -

example 1: Negative correlation between job satisfaction and # days absent from work
example 2: between amount of soup sold and temperature outside
example 3: between stress level and overall health
Curvilinear Correlations -

example: Level of arousal with performance on a task
Uncorrelated -

example: amount of creativity with shoe size
B. Magnitude:
Typically Correlations are not perfect.
1. Strong: Most of the time when variable A is high, variable B is high.
2. Moderate: An above average amount of the time when variable A is high, variable B is high.
3. Weak: A small amount of the time when variable A is high, variable B is high.
The direction and magnitude/strength of a correlation can be
statistically measured using a correlation coefficient.
Correlation coefficient is a descriptive statistic!
a. It falls within the range of -1 to +1.
(1) A correlation coefficient of -1
(2) A correlation coefficient of +1
(3) A correlation coefficient of 0
b. The stronger a correlation, the closer it will be to -1 or +1.
(1) .99
(2) .10
(3) -.80
(4) -.25
Correlation does NOT imply causation!!!!
example: A study showing a positive correlation between # of hours of violent TV watching and amount of aggressive behavior in children.
Tempted to conclude that
watching more violent television causes children to act more
violently.
BUT . . .
2 problems prevent us from drawing a causal relationship from correlational designs
1. Directionality Problem:
2 possible interpretations
1.
2.
2. Third-Variable Problem:
example: there is a positive correlation between the number of churches in a city and the amount of crime.
Does increased religiousness cause more crime?
Does more crime cause more religiousness?
Therefore, can only conclude that there is a relationship between
the variables of some kind, but cannot conclude that it is
a causal one.
IV. Why use a Correlational Design??
A.
B.
C.
D.
Regression analysis
A correlation tells you how strong the relationship is between 2 variables, and if it is significant.
A regression analysis
1.
2.

Example: Using SAT scores to predict how well a person does in college.
Multiple Regression
1. More than one variable used to predict another variable.
example:
2.
3.
4.