
Title
Reminding of basic Statistical terms
Accuracy is how close a measured value is to the true, or accepted value.
Precision
Precision is how reproducible measurements in a series are.
Error is anything that lessens a measurement’s accuracy or its precision.
Types of Errors:
Gross errors: (Fot instance: a mistake in a calculation).
Systematic error: ((Fot instance: weighing sample with a uncalibrated balance).
Random error: they arise from random events that are not necessarily under the control of the experimentalist
(as background noise).
Standard Devition
A measurement of precision for a data set is the standard deviation.
The value of the SD tells how closely the values of a data set are clustered around the mean.
SD has the same units of measurement.
Confidence interval is another estimate of precision.
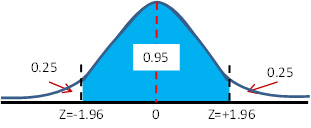
95% Confidence Interval means: it is at least a 95% probability of finding the “true” value in the range
(Meam + C.I.) and (Mean – C.I.)
So, a confidence limit also expresses a level of certainty that the true value lies within ±Δ of the average, in the absence of systematic error.
Note that as the precision of a set of measurements increases, Δ will decrease at a set confidence level. Higher confidence levels also reflect higher precision in the data set.
The interval of numbers between the (Meam + C.I.) and (Mean – C.I.) is called 95% confrdence interval for unknown true value (µ, true value )
(Example)
95% Confidence Interval
45 ±2
95% is confidence level
±2 is Confedence interval
45 ±2 means: 43 to 47 this range is confedence limit.
sometimes people called confedence limit. "confidence intervals".
It is correct to say that there is a 95% chance that the confidence interval you calculated contains the true population mean.
A problem often encountered while doing replicate measurements of a physical or chemical quantity is that of determining whether an outlying result is far enough away from the rest of the data to justify discarding it.
A number's precision relates to its decimal places or significant figures (or as preferred here, significant digits). The number of decimal places is the number of digits to the right of the decimal point, while the number of significant digits is the number of all digits ignoring the decimal point, and ignoring all leading zeros and some trailing zeros.
When we write a number, we assume that the precision is ±1 in the last number written:
Example: 5.436 g has a precision of ±0.001 g