SLUICE GATE THEORY
Open Channel Flow
Pressure at water surface is atmospheric
or zero gage pressure
Water surface = piezometric head level
I.e., level registered by manometer with a piezometric tap
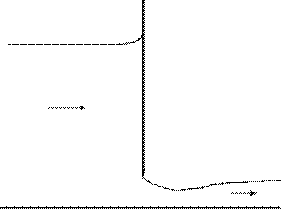
Open channel flow in general, has two possible flow depths for each energy level
Subcritical and supercritical
Sluice gate changes flow from
subcritical to
supercritical
FLOW UNDER SLUICE GATE
Like Flow Through Orifice
Minimum cross-sectional area (vena contracta)
slightly downstream from the gate
Ideal Flow Theory (No Energy Losses)
Q = V1*A1 = V2*A2
Experimental Studies
Discharge coefficient
Flow is never really “ideal”
Coefficient is related to relative size of gate
opening
Brater & King summarize some of these
General form Q = C*A*(2g*dH)0.5
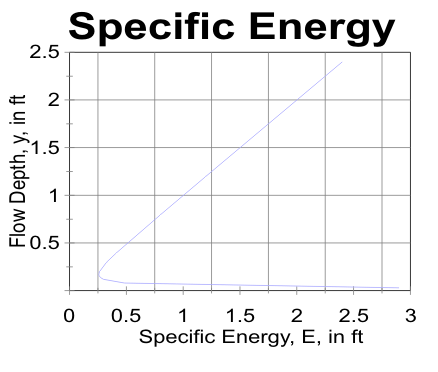
SPECIFIC ENERGY
Energy in an open channel measured relative to the
channel bottom E = y + V^2/2g
For two values of y with the same value of E
E = y1 + V1^2 /2g = y2 + V2^2 /2g
Combine this with the continuity equation,
V1*b*y1 = V2*b*y2
Now we can eliminate one of the velocities and compute
the other velocity without using Q.
This gives some experimental data for a two-dimensional
plot of specific energy to compare with the
theoretical equation
SPECIFIC ENERGY PLOT
To use this, we measure y2 at the vena contracta.
As an aside, the specific energy function,
E = y + Q^2 /2g*b^2 y^2, is actually cubic in y
I.e., -y^3 + E*y^2 = Q^2 /2g b^2
The subcritical and supercritical flows are two of the
three areas for the solution. The third area of the
solution has a negative value of y, which is
meaningless for open channel flow
SLUICE GATE EXPERIMENT
Study the application of one-dimensional flow analysis involving continuity, energy and momentum equations to a sluice gate in a rectangular channel
Flow Under A Sluice Gate
Two flow depths, subcritical and supercritical, for each energy level
Compare the measured values of y2 with values computed
for observed y1

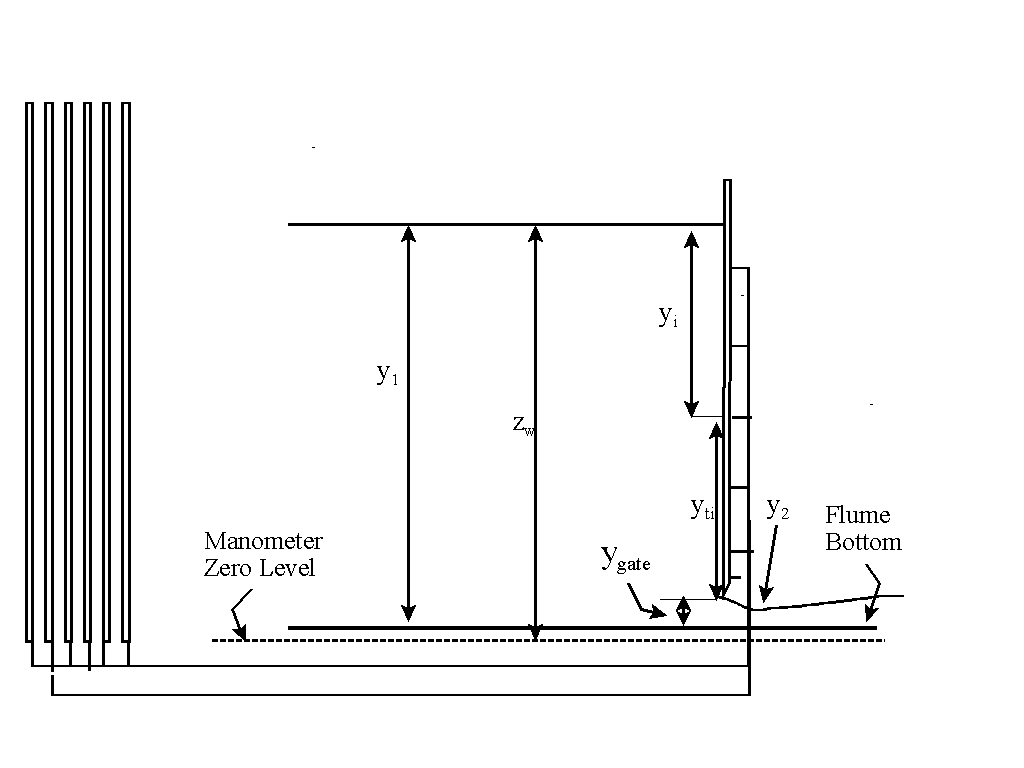
Note: Manometer (pressure) taps show the water pressure on the other side of the sluice gate in the center of the channel
FORCE BY MOMENTUM EQUATION
Fx = G* Vx *Q (with G=gamma) gives
Fg = G*[Q*(V1 -V2) + 0.5*b* (y1^2-y2^2)]
where G = density of water
g (in the drawing) = specific weight of water
Q = flow rate
v1, y1 = upstream velocity and depth
v2, y2 = downstream velocity and depth
b = width of rectangular channel
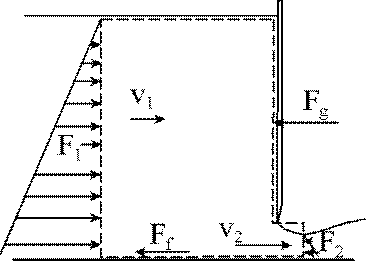
Force By Direct Measurement & By Hydrostatic Model
Direct measurement uses pressure measured at several points along the gate. The key is to select the area you associate with each pressure value.

Linear hydrostatic pressure uses the simple triangular pattern of pressure, with the average pressure at the center point times the area. (In our experiment, the top pressure is atmospheric, which we use as H1 of zero.)
Flow With An Abrupt Drop-Off
First a little background
Flow Types:
Zones 1, 2, & 3: Above both normal & critical depths (1), between normal & critical (2), and below both normal & critical (3)
Mild, Critical, & Steep slopes: Whether normal depth is above, at, or bellow critical depth
Speed of Sound in Water
Message moves to inform upstream flow of what is going on down-stream
If flow is subcritical, message goes up-stream and down-stream so flow can adjust
If flow is supercritical, water is moving faster than the message, so no message goes up-stream
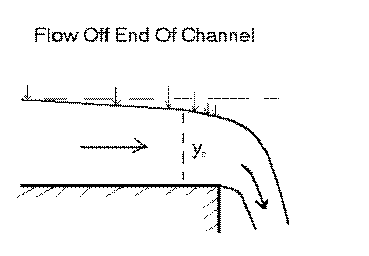
Flow Over The End of Our Horizontal Channel
Flow starts at subcritical because slope is zero & normal depth is infinitely high
Technically our flow is H2
Drop-off at end goes to critical depth and width becomes less as water drops (See graph below)
Zero pressure and Z1+V1^2 /2g = Z2+V2^2 /2g means Z is dropping & V is rising
(Water molecules grab each other, so those off the edge pull the ones behind to a little faster than speed of sound.)
SLUICE GATE EXPERIMENT: PREPARATION
OBJECTIVES (Presented above)
APPARATUS (Same flume & measurement taps as for
Weir Experiment, except tap on the sluice gate)
PROCEDURE:
Set up experiment.
Open surge tank valve. Open both the head and the tail (sluice) gates of the half-meter open channel unit
Determine the longitudinal profile along the centerline of the floor of the flume to get point gage zeros. (If not clear from a prior experiment.)
Remove air from all manometric tubing. Locate the pressure taps in the gate and on the floor of the flume and match them to the manometer columns.
Close the drain valve, start the large pump, and open the intake valve.
SLUICE GATE EXPERIMENT: Data Collection
Measure the profile and the sluice gate variables.
Establish a steady flow in the flume
Lower the upstream sluice gate until it impinges on the flow.
Slowly lower the gate until the flume is nearly full. Wait for the flow to reach the steady state.
[Note: remove air from the manometer tubes A-F.]
Record the flow depths of the water surfaces both upstream and downstream of the gate. For the supercritical section, you are trying to measure at the vena contracta.
Repeat step d until you have at least 6 measurements of depth
Measure the water surface profile near the downstream drop-off
Open both sluice gates to a level above the surface
of the water.
Measure the depth of the water at enough points to
show the surface shape. Note that the points need
to be closer as you near the end of the channel.
Shut off the flow. Turn off the pump, close the intake
valve, and open the drain valve on the head tank.
Sluice Gate in Our Flume
SLUICE GATE EXPERIMENT: RESULTS
Data, Calculations, and Results:
Attach your data sheet and sketch of the experimental set-up
V1 = Q/(b*y1) and V2 = Q/(b*y2)
Compare the specific energy (Ei = yi + Vi^2 /2g) plot for the observed depths and computed velocities with the theoretical plot at the same flow rate, Q
Compare the measured contraction coefficient with any hydraulic literature reference.
Using your depth measurements upstream of the gate and at the vena contracta, along with the continuity and energy equations, compute the flow rate and compare it with the rate given by the flow meter
Q = V1*A1 = V2*A2
Ei = yi + Vi^2 /2g or y1 + V1^2 /2g = y2 + V2^2 /2g
Combining these: Q = 2g*b* y1* y2 / (y1 + y2)^0.5
Compute the force on the gate using (a) the measured pressures, (b) hydrostatic assumption, and (c) the momentum equation. Compare the three values in terms of accuracy and convenience.
Plot the pressure distributions on the upstream side of the sluice gate from the measured pressures and from the hydrostatic assumption on the same chart and compare the two patterns.
Plot the flow depth data for the flow off the end of the half-meter flume.